November 3rd, 2014 § § permalink
In the song “The Book Report” from the musical You’re A Good Man, Charlie Brown, Lucy van Pelt struggles to complete her homework assignment: 100 words on Peter Rabbit. Falling short, she concludes it thusly: “And they were very very very very very very happy to be home. The very very very end.”
 In honor of this blatant effort to reach a designated threshold without utilizing meaningful content, I would like to present the very very very first “Lucy Van Pelt Award for Verbal and Political Padding” to Senator Tom Coburn (R, Oklahoma), for the 2014 edition of his much-publicized “Wastebook.” For those who haven’t heard of it, the Wastebook is Coburn’s perennial compilation of excessive and/or unnecessary federal spending. It tends to generate a good bit of attention for its most absurd items in all manner of media. A careful parsing of Coburn’s annual lists may reveal a partisan bent and a truckful of snark, though in reviewing the past few years of reports, I did note that he wasn’t above calling attention to what he deemed wasteful spending in his home state too.
The new report, on its comic book meets tabloid cover, trumpets $25 billion in government waste in only 100 examples. Without being deeply grounded in every item he cites, I must admit that a few do make one wonder. However, I have to chide Coburn for a few of his 2014 examples, specifically those derived from National Endowment for the Arts grants. Alongside “Swedish Massages for Rascally Rabbits” and “Watching Grass Grow,” Coburn calls out:
- “Teen Zombie Sings, Tries To Get A Date To The Dance” ($10,000 for the musical Zombie in Love at Oregon Children’s Theatre)
- “Colorado Orchestra Targets Youth With Stoner Symphony” ($15,000 for a Colorado Symphony concert thematically linked to the state’s newly legal industry, but performing standard symphonic works)
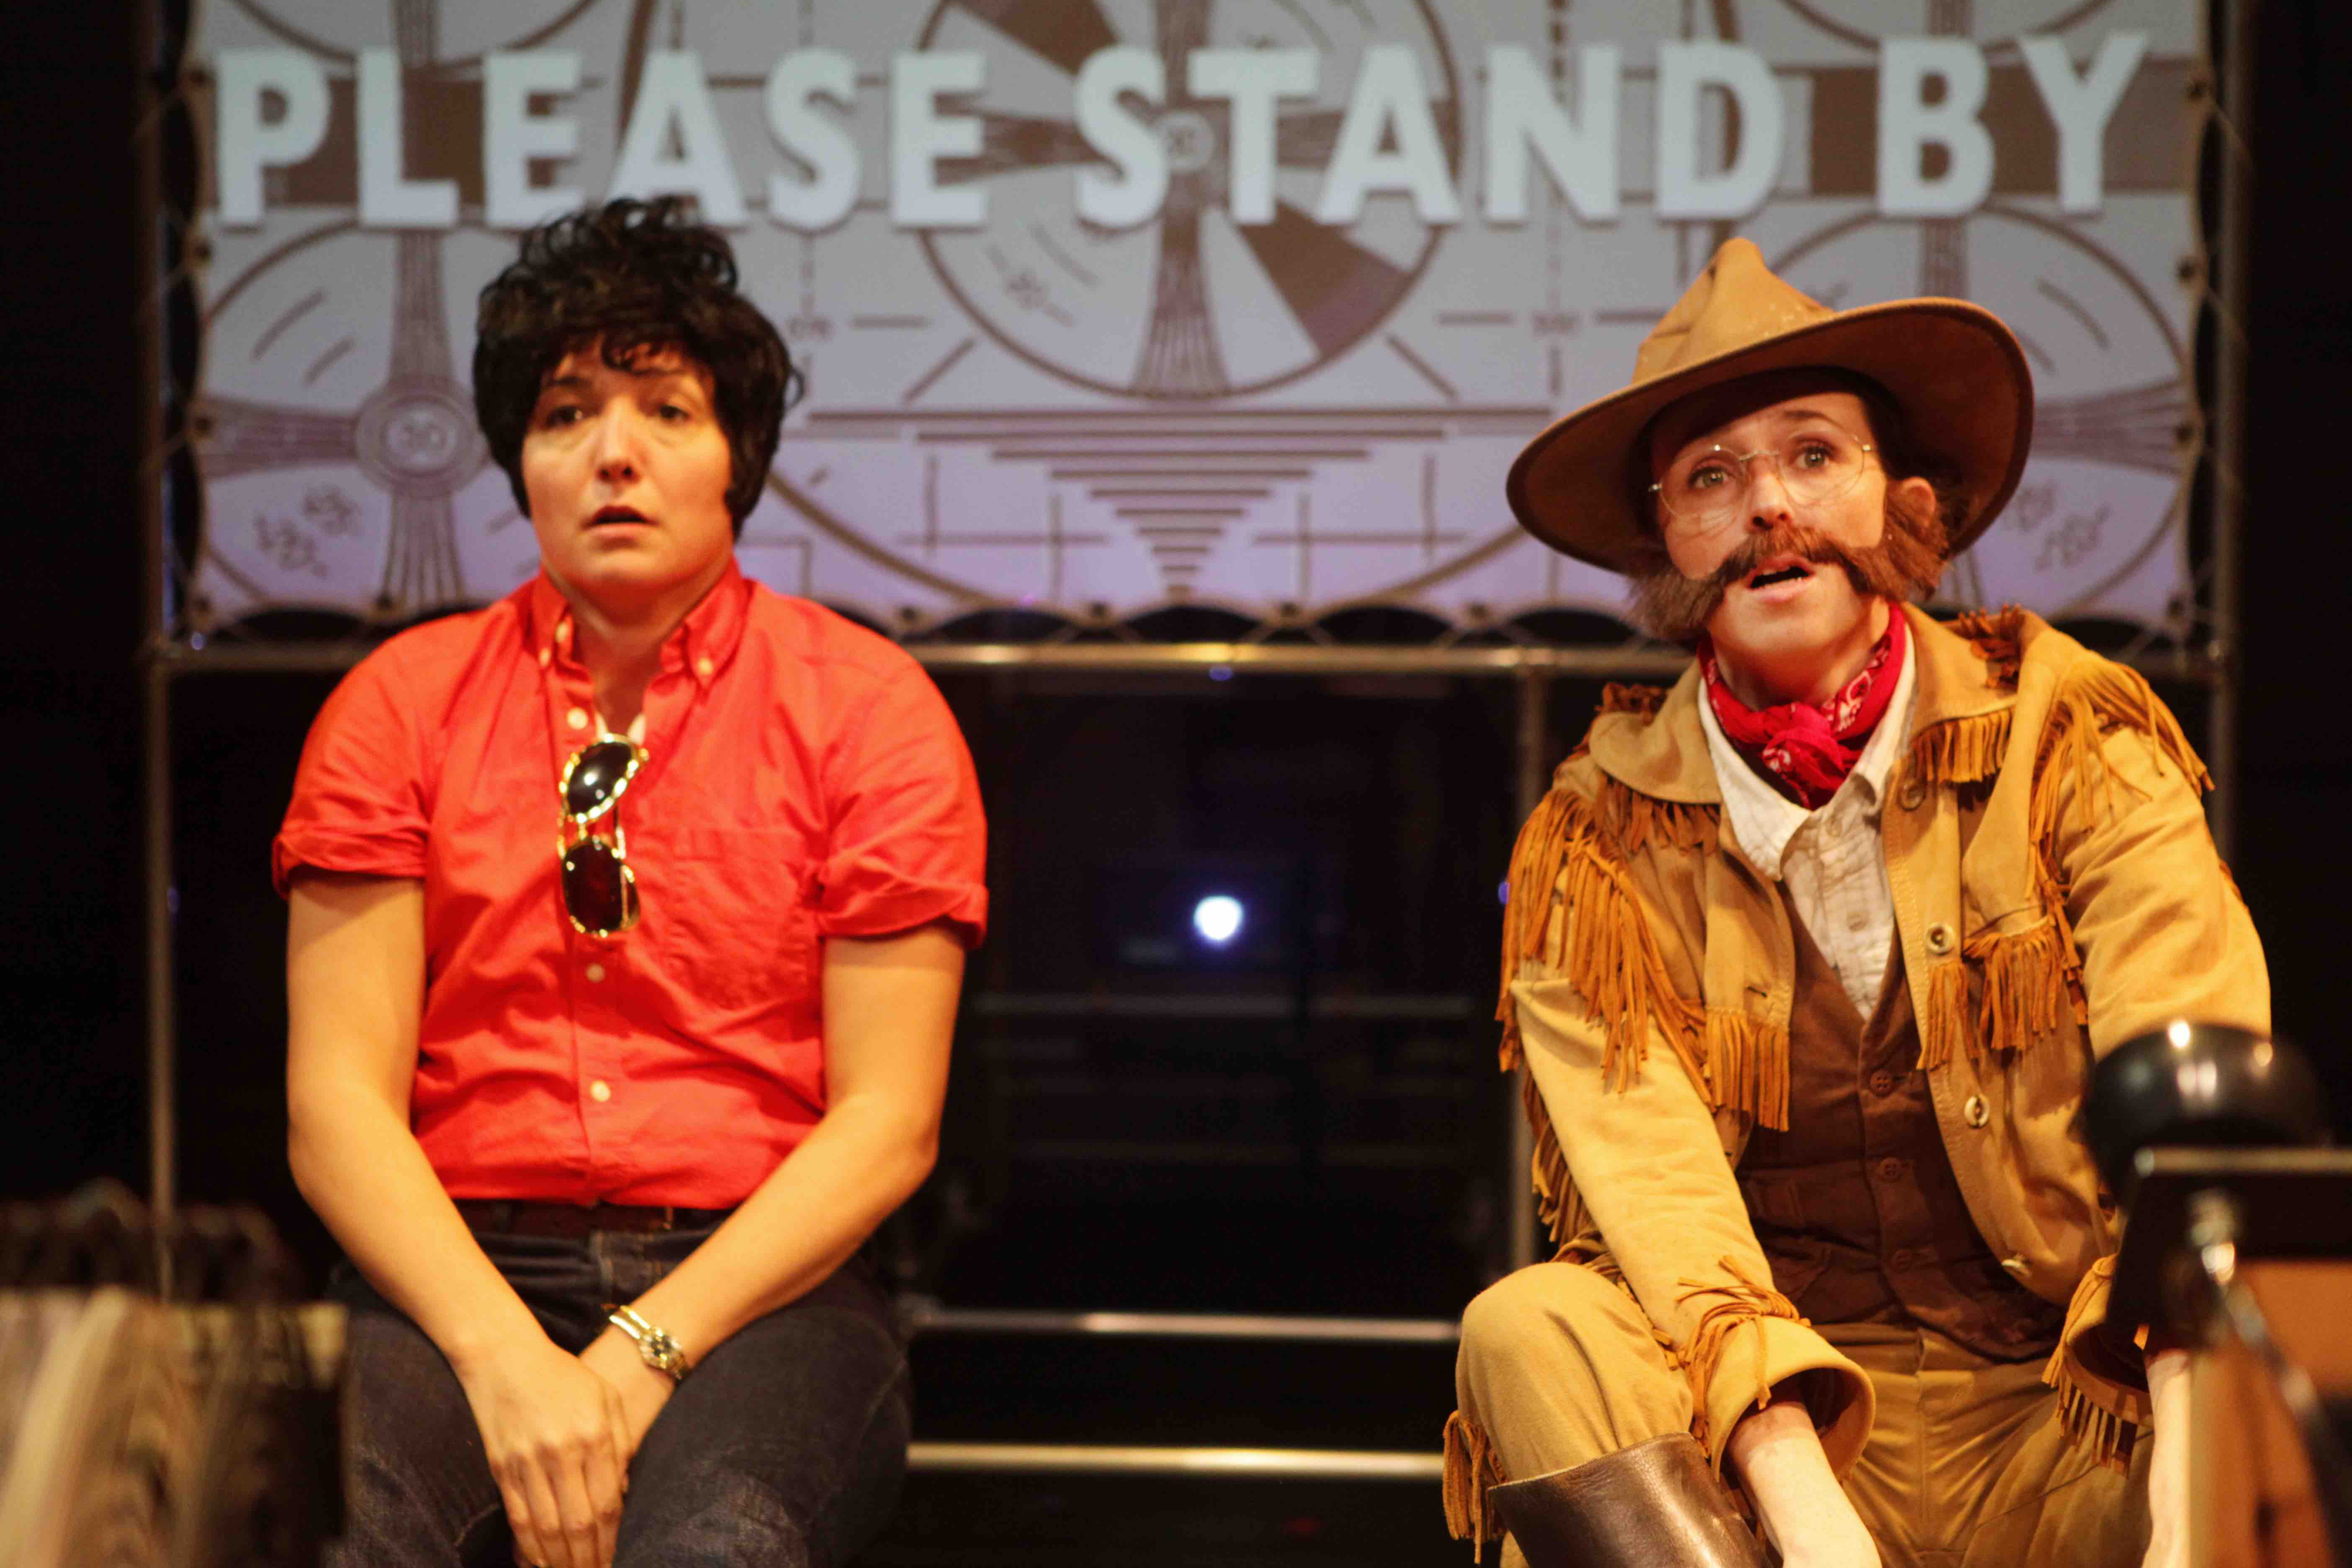
- “Roosevelt and Elvis Make A Hallucinatory Pilgrimage To Graceland” ($10,000 to The TEAM for their play RoosevElvis, to be seen this winter at the COIL Festival)
- “Bruce Lee Play Panned As Promoting Racial Stereotypes” ($70,000 to Signature Theatre Company for the production of David Henry Hwang’s Kung Fu)

Libby King and Kristen Sieh in The TEAM’s RoosevElvis (Photo by Sue Kessler)
While Coburn surely hasn’t seen or read any of these productions, his efforts to make these minimal grants into shameful instances of government funds gone awry relies only on inevitably reductive synopses and selectively quotes from the odd negative review as if to justify his point about these NEA funded projects. The headlines are of course chosen to make the work itself sound as absurd as possible. Worth noting: Coburn seems to have a particular distaste for children’s theatre, having also called out $10,000 for the production of the musical Mooseltoe at the Centralia Cultural Society in Illinois in the 2013 Wastebook. There are other arts related items in the 2014 report, but they’re actually funded outside of the NEA, the largest being $90 million for the State Department’s Cultural Exchange programs, targeted by Coburn for a handful of unconventional performers he selected from a much larger pool, a rigged argument at best.
Coburn’s increased role as an arts critic is no doubt due to the mileage he got out of his 2013 list’s inclusion of a $697,000 grant to the theatre company The Civilians for their musical The Great Immensity, about climate change. Obviously the subject matter was a hot-button for the Senator, and I imagine that numerous arts groups must be envious of the sum (far in excess of what groups typically get from the NEA), but Coburn fails to take into account the respect accorded to the work of The Civilians in artistic circles – and arts groups should take note that the largesse came not from the NEA, but from the National Science Foundation, due to the specific subject. It may be a bigger and easier target for Coburn, but it’s not a worthy one.
Whatever the politics and bias behind it, I’m willing to grant that there’s some value in Coburn’s list, such as highlighting the famous Alaskan Bridge to Nowhere or calling out excessive spending on the incompetent overhaul of government computer systems. But his four NEA-based examples this year are simply padding, as they represent only 0.00042% of his report’s dollar total, but 4% of his report. It’s just another example of a politician attacking the arts as an easy target, when there are bigger and more essential fish to fry.

Cole Horibe in Kung Fu at Signature Theatre (Photo: Joan Marcus)
Regarding the four “wasteful” grants in question, I can offer a personal opinion on only one, namely Kung Fu, which was ambitious and perhaps not completely realized in its debut at Signature. But it was – and is – a worthy project by an artist whose work is always deserving of support. By the way, David Hwang has told me there’s more work to be done on the piece and he’s recently made public note of plans to remount it soon to implement further changes. When that happens, I’ll do my best to invite Senator Coburn to Kung Fu as my guest though he may be out of the public eye and not up to it – he’s leaving Congress at the end of the year for health reasons, and this year’s list may be his parting shot.
Of course, health permitting, Coburn could keep producing the Wastebook after leaving office, if he has a real commitment to exposing government waste. But I’m willing to bet that he won’t. Why do I say that? Because surely most people realize that his annual screed is produced by his staff, maybe even eager young interns, not by Coburn’s own personal research and writing efforts. Come to think of it, I wonder how much the Wastebook cost the U.S. taxpayer each year, in staff research and writing time? I suspect it’s more than the federal government gave to Mooseltoe.
P.S. Let’s all go see The TEAM’s RoosevElvis when it plays New York’s P.S. 122 in January 2015 and each decide for ourselves whether the $10,000 from the NEA was well spent. I, for one, wasn’t aware of the show, but I’m now looking forward to it. Gee, thanks Senator Coburn!
May 28th, 2014 § § permalink
 It’s a funny thing about milestones, the way certain thresholds get set in our minds. If you follow reporting on the movie industry, breaking the $100 million gross barrier is a major achievement (and for those of us in the arts, an astronomical figure), although its not always connected to the cost of the film under discussion. But that number has been a yardstick for years, once cause for double page ads in Variety whenever it was reached, regardless of whether the movie that achieved it was released in the 60s, 70s, 80s or today – despite inflation making the success happen a little faster with every passing year. To be sure, plenty of movies still don’t make it, but it’s a less rarified club than it was in the days of The Sound of Music or Star Wars.
Once upon a time, when people still spoke of the price of a loaf of bread as an economic indicator, gas prices crossed a big threshold when a gallon broke over the $1.00 price point. People under 40 may not even remember this being breached. This was a big deal in those non-digital days, when prices couldn’t simply be altered with a tiny bit typing; I happened to be in England a few years back when the price of a liter of petrol broke the £1 mark, resulting in some creative solutions to signage that never anticipated announcing such a sum.
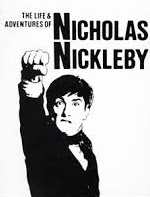 In theatre, in my lifetime, the big round number that sticks in my memory was the $100 ticket for The Life and Adventures of Nicholas Nickleby, though it could be explained away by the massive physical production, cast size and length. It seemed a one-off as opposed to a trend-setter. Miss Saigon had $100 tickets at the start of its run, but didn’t sustain them, dropping back to the then more typical $65. The $100 price cropped up again for the 1999 revival of The Iceman Cometh, which by virtue of its length, simply couldn’t give enough performances in a week to make economic sense otherwise. You may know of other isolated instances.
 We didn’t truly reach the $100 asking price per ticket milestone until The Producers introduced the $100 ticket in the wake of rave reviews, also giving us the innovation of the VIP ticket at the extraordinary price of $480. This was in 2001, just 13 years ago. At the time, other hits were quick to match The Producers, with Mamma Mia! jumping to $100 per ticket just two months later.
But it should be noted that the $100 price was the theatre equivalent of a hotel’s “rack rate,” the stated top price for rooms which were in reality variable and negotiable. In theatre, through group sales, discount offers, the beloved TKTS booth and day of show lotteries you could still see a Broadway show for much less than that. As a result, over the past decade, while regular prices have risen, especially at the most successful shows, the average price paid on Broadway stayed under $100 per seat. That is, until last year, the just-completed 2013-14 Broadway season, when the average ticket was $103.92, up $5.50 over the year before.
So while articles may be trumpeting record revenues and record attendance, they’re either downplaying, avoiding or ignoring the true breaking of the $100 threshold, preferring to lead with the allure of numbers in the millions (attendance) or billions (dollars). That’s a shame, because in terms of what matters to the average audience member, the average ticket price seems much more essential news. To me, that’s the headline.
 It’s always important when discussing prices over time to acknowledge overall price changes in comparable fields or the economy as a whole. So let me point out that in the period since The Producers in 2001, the Consumer Price Index has risen from 177 to 233, an increase of 32%. The average movie ticket price nationally has gone from $5.65 to $8.13, a jump of 44%. But the Broadway jump from $58.72 to $103.92? That’s an increase of 77%.
I don’t have the resources to analyze all of the factors contributing to that jump, beyond the prevalence of premium or VIP seating, along with hit shows with higher prices that don’t need to discount (The Book of Mormon and Wicked) and superior supply and demand management (The Lion King). Maybe Nate Silver and his Five Thirty Eight team could work on this and tell us whether there’s a valid economic underpinning, or whether its just naked supply and demand having its day.
But surely if Broadway price hikes outstrip the economy and even other entertainment options, Broadway will eventually reach a tipping point that could have an impact on the already dicey economics of producing and running shows. Purchasing decisions based on price could put even more shows at risk for sustaining an economically viable run, whether in theory, as a Broadway engagement is contemplated, or even once it’s up and running.
So I want to call out this pricing milestone for all to see, and wonder where it will lead our commercial theatre yet a few more years down the line. If price resistance takes hold, if the Broadway price-value equation tips too far with the former outweighing the latter, will it be a place where shows can only be smash hits and utter flops, with no mid-level performers managing to run? If that happens, I hope it will prompt more people to sample institutional and independent theatre, here in New York and elsewhere. But on Broadway, and indeed at every level in the arts, ticket pricing is our global warming crisis, steadily rising year after year without raising true alarm and provoking meaningful action, until it threatens to swamp us all.
September 27th, 2013 § § permalink

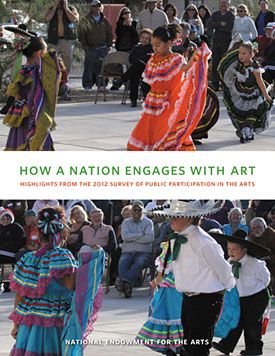
The 2012 NEA SSPA Report
If yesterday’s news that theatre attendance is down more precipitously than any of the arts caused you to spit out your coffee over breakfast, well that’s probably because you haven’t been paying attention. To be fair, I suspect a lot of people haven’t been, with virtually every discussion of the performing arts in since 2008 having been prefaced with either “in these challenging times” or “since the financial meltdown of 2008.” But the time for qualifiers and excuses is clearly past, especially as every news report on American life in general seems to invoke the fairly recent cliché “the new normal.” Things have changed. Things are changing. Things will change. The arts need to change.
In citing slides of 9% for musical theatre and 12% for non-musicals over the past five years, and even more pronounced numbers over a longer range, the picture painted by the NEA shows an overall decline in arts attendance, with theatre hardest hit. Coming just days after some co-mingled summary numbers from an Americans for the Arts report suggested theatre might be looking up, it was certainly startling news. But a closer look at the latter study actually confirms the reported NEA trend.
Looking elsewhere, the same picture appears. The last Theatre Communications Group “Theatre Facts” report, covering results from 2008 to 2012, shows a 1.8% decline in attendance in the portion of their membership studied – not as pronounced as the NEA figures, but certainly heading the wrong way as well. It’s also important to remember that as expansive as it is, TCG itself is only a subset of overall US theatres. In a more easily defined theatrical realm of activity, Broadway in the same period shows a 5% audience decline, with a 17% increase in income, suggesting an increasingly inaccessible theatrical realm, and an economic model that will only further stratify audiences.

The Ticketmaster UK Report
The only encouragement that one might wish to cling to is a report from Ticketmaster’s analytics division, which shows stunningly positive stats about arts participation by younger audiences (including a snappy infographic). While it hints that there might be some lessons to be learned, we’d have to go to England to get them, because the study is entitled State of Play: Theatre UK. While it does include some US audience members (as well as a selection from Ireland, Germany and Australia), the US sample represents only 13% of the total, with 65% from the UK. Also, under theatre, Ticketmaster has folded in opera and dance, so it’s not a true apples to apples comparison.
Now I am one of the many who believes that theatre as a discipline will manage to survive the onslaught of electronic entertainment precisely because it is live and fundamentally irreproducible. We may be a niche, but there will always be those who treasure being in the same room with artists as art is created; I have often joked that theatre will only be in real danger when Star Trek: TNG’s holodeck becomes reality. Even these reports don’t sway me from that conceptual position. But I’m not sticking my head in the sand either.
Appreciation of the arts is, for many, something that is learned in childhood – namely in schools. Yet we only have to read about the state of public education to know that resources are diminished, anything that isn’t testable is expendable, and fewer students are being exposed to arts education than they were years ago. Citing the 2008 NEA SSPA report: “In 1982, nearly two-thirds of 18-year-olds reported taking art classes in their childhood. By 2008, that share had dropped below one-half, a decline of 23 percent.” In less than 30 years, inculcation in the arts through the schools declined notably, so is it any wonder that we’re seeing declines in arts participation over time?
In a 2012 Department of Education study, it was reported that “the percentages of schools making [music and visual arts] available went from 20 percent 10 years ago to only 4 and 3 percent, respectively, in the 2009-10 school year. In addition, at more than 40 percent of secondary schools, coursework in arts was not required for graduation in the 2009-10 school year.” That’s all the more reason to be concerned. Certainly many arts organizations have committed to working with or in schools, but are the programs comprehensive enough? We’ve become ever more sophisticated in how to create truly in-depth, ongoing education experiences, but perhaps in doing so, we’re reaching fewer students. Maybe we have to look at how to restore sheer numbers as part of that equation, while maintaining quality, to insure our own future.

Art from Americans for the Arts report
It’s time to make an important distinction. As I said, I believe ‘theatre’ will survive for years to come. Where we would do well to focus immediate attention is on our ‘theatres,’ our companies. On a micro basis, it may be easy to shrug off declines, especially if you happen to be affiliated with a company that is bucking the trend. But these reports with their macro view should take each and every theatre maker and theatre patron outside of the specifics of their direct experience to look at the field, not simply year to year, but over time. It suggests that there is a steady erosion in the theatergoing base, which hasn’t necessarily found a new level; just as a rising tide floats all boats, eventually our toys lie at the bottom of the tub once the drain is opened.
I don’t have the foresight to know where this will lead. One direction is that of Broadway, where the consistently risky business model favors shows that are built for the truly long run, but only for the select audiences with the resources to support ever increasing prices. Might that be mirrored in the not-for-profit community as well, with only the largest and most established companies able to secure audiences and funding if resources and interest truly diminish? Or might we see a shift away from institutions and edifices and towards more grass roots companies, where simpler theatre at lower prices and more basic production values finds the favor of those who still harbor an appetite for live drama?
I’ll make a prediction. While in the first half of my life I watched the bourgeoning of the resident theatre movement, which in turn seeded the growth of countless smaller local companies, my later years will see a contraction in overall production at the professional level; it’s already begun, as a few companies seem to go under every year and have been for some time. That means that it will become ever harder for people to make their lives in theatre, because there will be fewer job opportunities for them.
Since I’ve already employed science fiction in my argument, let me turn to it again. We’ve all seen or read stories where someone goes back in time to right some past wrong (and for the moment, let’s forget that they often as not ruin the future in the process). Is there a point where we could or should make some fundamental change in how theatre functions – not as an art, but as an industry? Is there a single watershed moment where one choice determined the course of the field that some future time traveler could set right? I suspect not, unless we were talking about preventing (in succession) the discovery of electricity, the invention of TV and movies, or the creation of the internet.
That’s why we have to shift the paradigm now, and not just worry about selling tickets to the current show or meeting next year’s budget, but focus on what’s truly sustainable in 10, 25 or 50 years time. This week’s data barrage shows one thing we mustn’t ignore: even if we can’t see it in our own day to day experience, what we’re doing now isn’t working and the tide is going out.
My thanks to Mariah MacCarthy, who brought the 2008 NEA SSPA Report summary and the 2012 Department of Education report to my attention.
September 26th, 2013 § § permalink
If you’ve been reading The New York Times and The Los Angeles Times this week, attempting to find out how the arts as a whole are doing, you would likely get a fairly consistent picture coming from the efforts of those two sources, and it doesn’t bode well for the arts in America. But if your focus happens to be on theatre, your head might spin from seeming conflicts.
On Monday, September 23, in The Los Angeles Times, Mike Boehm reported the Americans for the Arts just issued National Arts Index of arts participation, complete through 2011. He wrote, using their executive summary, “The report noted ‘overall increases’ in theater and symphony attendance in 2011, and drops for opera and movies.” Good news for the theatre crowd, right?
Well this morning, Patricia Cohen, writing in The New York Times about the National Endowment for the Arts newly released “Highlights from the 2012 Survey of Public Participation in the Arts,” made the startling statement that “theater is the artistic discipline in America that is losing audience share at the fastest rate in recent years.” Scary, no?
So the question is, are these reports in conflict? Is there some underlying difference in methodology that has yielded markedly different results? Is it because the Americans for the Arts report is only through 2011, while the National Endowment for the Arts report is through 2012?
Much as I’d like to tell you that things are not as negative as the New York Times story makes it seem, the discrepancy is in fact due largely to aggregation of disciplines on the Americans for the Arts summary, while the NEA report keeps each art form distinct – as does the full text of the Americans for the Arts study. The rosier picture Boehm drew from Americans for the Arts emerged because it merges theatre with symphony and opera and, perhaps to the surprise of many, the latter disciplines had a very good year in 2011.

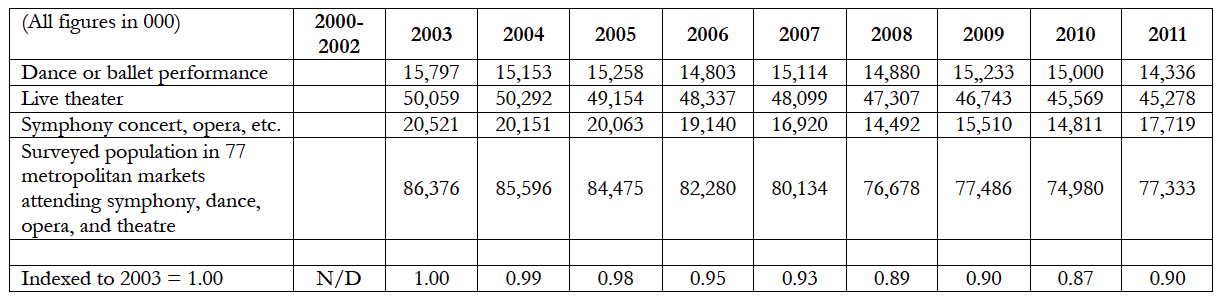
From the Americans for the Arts Report
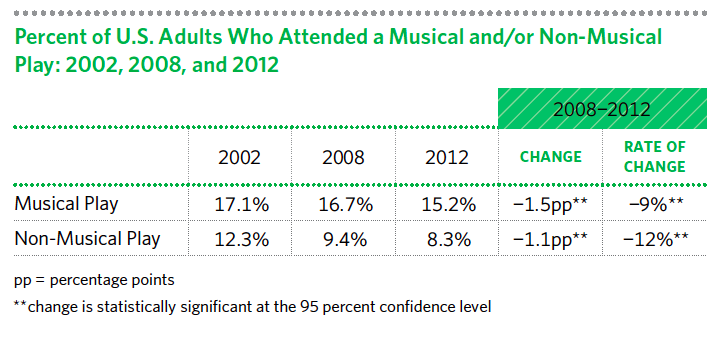
Symphony and opera attendance increased by almost 3 million from 2010 to 2011, while theatre attendance was down by about 300,000 in the same period. So in merging, the loss in theatre is masked by the jump in symphony and opera. The discrete numbers in the NEA report, sampled in 2002, 2008 and 2012, show an ongoing decline for theatre, with the rate of change for musicals at -9% and the rate of change for plays at -12%. This mirrors an aggregate decline from 50 million to 45.2 million theatre patrons over the period from 2003 to 2011, as shown by Americans for the Arts.

From the National Endowment for the Arts report
So while summaries may indicate that there’s some upside for theatre, the detail of the reports are quite clear: theatergoing is trending down. If there’s another comprehensive report that actually challenges this data, it would be good to see it, but if the combined results from these two central representatives and supporters of the arts in America have yielded comparable results, the wake up call for theatre cannot be sounded any more loudly and clearly. No one should cling to shreds seemingly offered in a part of one study. To be sure, theatre’s overall attendance numbers far outpace symphony, opera and dance combined, but the trend doesn’t look good at all. And with arts attendance/participation in general decline, can theatre collectively get its act together to stop the bleeding, let alone reverse course?
I urge anyone working in the arts, in any discipline, to study both of these reports carefully. By all means, get beyond summaries and condensations. I’ve only focused on a few pages and I’m quite certain we’ve got a lot more to learn if we’re going to be able to generate good news about the field again and continue to make the case for the vitality and centrality of the arts in American life.
P.S. When a government agency and an advocacy group agree about the problems in American arts, wouldn’t it be nice if our president cared enough to even nominate someone to run the Endowment? The clock keeps ticking, but that’s the only sound we hear.
September 11th, 2013 § § permalink
 This afternoon on Twitter, journalists were decrying the proliferation of the word “premiere” in theatres’ marketing and press materials, especially in cases where the usage is parsing a point rather finely or declaring an outright untruth. I feel for Jason Zinoman, Johnny Oleksinski, Charles McNulty, Diep Tran, Kelly Nestruck and their peers, because at times they may have editors wanting them to take note of important distinctions, but don’t necessarily have a complete production history in order to insure accuracy. Having previously explored the obfuscations of arts communication in Decoder and Decoder II (which remain inordinately popular), it falls to me to dissect this phenomenon.
How has “premiere” metastasized? World premiere. U.S. premiere. East coast premiere. West Coast premiere. Professional premiere. New York premiere. Broadway premiere. Regional premiere. Area premiere. Local premiere. World premiere production. Shared premiere. Simultaneous premiere. Rolling premiere. I’m sure I’ve missed some (feel free to add them in the comments section).
So what is this all about?
It’s a sign of prestige for a theatre to debut new work, so “world” and “U.S.” premieres have the most currency. This is the sort of thing that gets major donors and philanthropic organizations interested, the sort of thing that can distinguish a company on grant applications and on brochures. You would think it’s clear cut, but you’d be wrong.
If several theatres decide to do a brand new play all in the same season, whether separately or in concert with one another, they all want to grab the “premiere” banner. After all, it hadn’t been produced when they decided to do it, they can only fit it into a certain spot, and they can’t get it exclusively, but why shouldn’t they be able to claim glory (they think). Certainly they’re to be applauded for championing the play, and reciprocal acknowledgment is worthy of note.
But still I imagine: ‘Oh, there was a festival production, or one produced under the AEA showcase code? Well surely that shouldn’t count,’ I can hear some rationalizing. ‘We’re giving it more resources and a longer run. Besides, the authors have done a lot of work on it. Let’s just ignore that production with three weeks of paid audiences and reviews. We’re doing the premiere.’
Frankly, sophisticated funders and professional journalists aren’t fooled. But there are enough press release mills masquerading as arts news websites to insure that the phrase will get out to the public. If anyone asks, torturous explanations aimed at legitimizing the claims are offered. When we get down to “coastal,” “area,” “local” and the like, it’s pretty transparent that the phrase is being shoehorned in to tag onto frayed coattails, but at least those typically have the benefit of being honest in their microcosmic specificity. That said, if multiple theatres, separately or together, champion a new play, they’re to be applauded, and reciprocal acknowledgment is worthy of note.
In the 1980s, regional theatres were being accused of “premiere-itis,” namely that every company wanted to produce a genuine world premiere so that it might share in the author’s royalties on future productions, especially if it traveled on to commercial success. Also, there was funding specifically for brand new plays that was out of reach if you did the second or third production, fueling this dynamic. Many plays were done once and never seen again because of the single-minded pursuit of the virgin work. To give credit where it’s due, that seems less prevalent, even if it has done a great deal to make the word “premiere” immediately suspect. But funders and companies have realized the futility of taking a sink or swim attitude towards new work.
To give one example about how pernicious this was, I was working at a theatre which had legitimately produced the world premiere of a new musical, and the company had been duly credited as such on a handful of subsequent productions. But when the show was selected by a New York not-for-profit company, I was solicited to permit the credit to be changed to something less definitive – and moved away from the title page as is contractually common – lest people think this was the same production and grow ‘confused’. I didn’t relent, but it’s evidence of how theatres want to create the aura of origination.
I completely understand why journalists would be frustrated by this semantic gamesmanship, because they shouldn’t have to fact check press releases, but are being forced to do so. That creates a stressful relationship with press offices, and poor perception of marketing departments, when in some cases the language has been worked out in offices wholly separate from them. Have a little sympathy, folks.

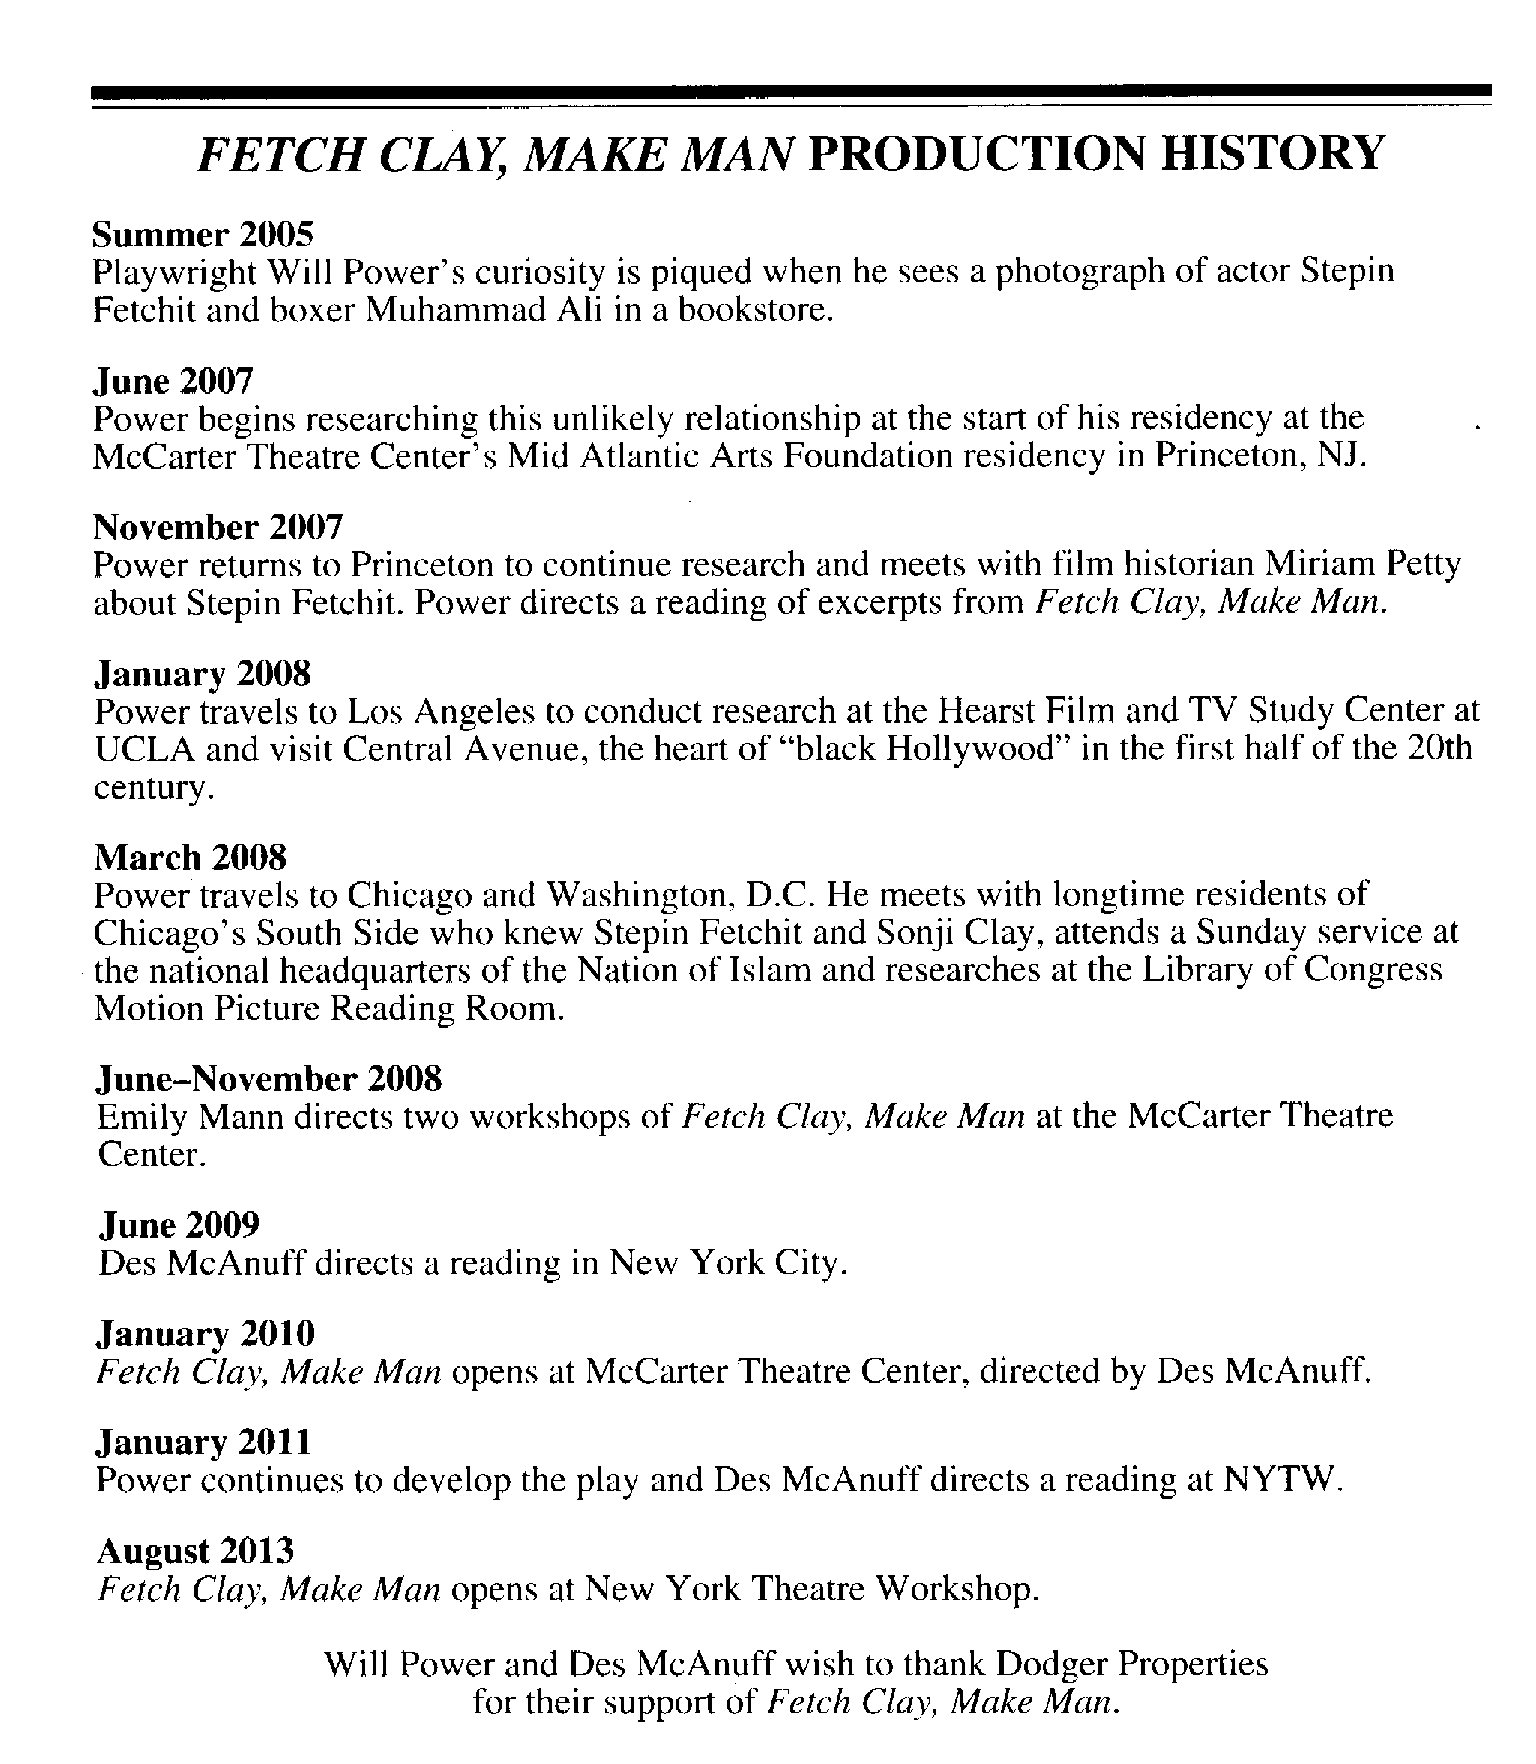
Production history of Will Power’s
Fetch Clay, Make Man
That said, at every level of an organization, truth and accuracy should be prized, not subverted. What’s happening at the contractual level insofar as sharing in revenues is concerned is completely separate than painting an accurate picture of a play’s life (the current New York Theater Workshop Playbill for Fetch Clay, Make Man provides a remarkably detailed and honest delineation of the play’s development and history, by way of example). Taking an Off-Broadway hit from 30 years ago may in fact be its “Broadway debut,” but “premiere” really doesn’t figure any longer, since there’s little that’s primal or primary about it. If you’re based in a small town with no other theatre around for miles, I suppose it’s not wrong to claim that your production of Venus In Fur is the “East Jibroo premiere,” but does anyone really care? It’s likely self-evident.
Let’s face it, any catchphrase that gets overused loses all meaning and even grows tiresome. If fetishizing “premiere” hasn’t yet jumped the shark quite yet, everyone ought to realize that there’s blood in the water.
P.S. Thank you for reading the world premiere of this post.
Thanks to Nella Vera and David Loehr for also participating in the Twitter conversation that prompted this post, which has been recapped via Storify by Jonathan Mandell, including some comments I’d not previously seen.
March 6th, 2013 § § permalink

“There is nothing quite as wonderful as money! There is nothing quite as beautiful as cash!”
I have made no secret of my disdain for the practice of announcing theatre grosses as if we were the movie industry. I grudgingly accept that on Broadway, it is a measure of a production’s health in the commercial marketplace, and a message to current and future investors. But no matter where they’re reported, I feel that grosses now overshadow critical or even popular opinion within different audience segments. A review runs but once, an outlet rarely does more than one feature piece; reports on weekly grosses can become weekly indicators that stretch on for years. If the grosses are an arbiter of what people choose to see, then theatre has jumped the marketing shark.
So it took only one tweet to get me back on my high horse yesterday. A major reporter in a large city (not New York), admirably beating the drum for a company in his area, announced on Twitter that, “[Play] is officially best-selling show in [theatre’s] history.” When I inquired as to whether that meant highest revenue or most tickets sold, the reporter said that is was highest gross, that they had reused the theatre’s own language, and that they would find out about the actual ticket numbers.” I have not yet seen a follow up, but Twitter can be funny that way.
As the weekly missives about box office records from Broadway prove, we are in an endless cycle of ever-higher grosses, thanks to steady price increases, and ever newer records. That does not necessarily mean that more people are seeing shows; in some cases, the higher revenues are often accompanied by a declining number of patrons. Simply put, even though fewer people may be paying more, the impression given is of overall health.
I’m particular troubled when not-for-profits fall prey to this mentality as part of the their press effort, and I think it’s a slippery slope. If not-for-profits are meant to serve their community, wouldn’t a truer picture of their success be how many patrons they serve? In fact, I’d be delighted to see arts organizations announcing that their attendance increased at a faster pace than their box office revenue, meaning that their work is becoming more accessible to more people, even if the shift is only marginal. If selling 500 tickets at $10 each to a youth organization drags down a production’s grosses, that’s good news, and should be framed as such, unless our commitment to the next generation of arts attendees is merely lip service.
From my earliest days in this business, I have advocated for not-for-profit arts groups to be recognized not only as artistic institutions, but local businesses as well. While I think that has come into sharper focus over the past 30 years, I’m concerned that the wrong metrics are being applied, largely in an effort to mirror the yardstick used for movies. It’s worth noting that for music sales or book sales, it’s the number of units sold, not the actual revenue, that is the primary indicator of success, at either the retail or wholesale level (although more sophisticated reporting methods are coming into play).
In a recent New York Times story about a drop in prices at the Metropolitan Opera, I was startled by the assertion that grosses were down in part because donor support for rush tickets had been reduced. Does that mean that fewer tickets were being offered because there wasn’t underwriting for the difference in price? Does it mean that the donor support was actually being recognized as ticket revenue, instead of contributed income? What does it mean for the future of the rush program if the money isn’t replaced – less low-price access? No matter how you slice it, something is amiss.
That said, the Met Opera example brings out an aspect of not-for-profit success that is, to my eyes, less reported upon, namely contributed revenue. Yes, we see stories when a group gets a $1 million gift (in larger cities, the threshold may be higher for media attention). But we don’t get updates on better indicators of a company’s success: the number of individual donors, for example, showing how many people are committing personal funds to a group. The aggregate dollar figure will come out in an annual report or tax filing, but is breadth of support ever trumpeted by organizations or featured in the media? I think it should be. I also can’t help but wonder whether proclaiming high dollar grosses repeatedly might serve to suppress small donations.
Not-for-profit arts organizations exist in order to pursue creative endeavors at least in part in a manner different from the commercial marketplace. Make no mistake, the effort to generate ticket sales for a NFP is equivalent to that of a commercial production, but the art on offer is (hopefully) not predicated on reaching the largest audience possible for the longest period possible. When NFP’s proclaim box office sales records, they are adopting a wholly commercial mindset. While it may appeal to the media, because it aligns with other reportage of other similar fields, it disrupts the perception of the company and their mission. And look out when grosses drop, as they inevitably will at some point.
We all love a hit, whether it’s the high school talent show or a new ballet. But if all we can use to demonstrate our achievements is how big a pile of money we’ve made, well then forgive me if I’m a bit grossed out.
December 10th, 2012 § § permalink
 Many people, and I count myself among them, often find themselves trying to quantify the totality of theatre activity in the United States and, within that, to delineate differences between the various sectors: commercial, not for profit, educational, amateur and so on. While absolute figures may prove elusive, there are a handful of studies that provide a reasonably good picture of professional production, lending perspective to any discussion about the reach of theatre in America.
The Broadway League, the professional association of theatre producers in the commercial sector, both Broadway and touring, generates multiple reports annually; its recent release of its annual demographic figures last week focused a lot of attention on Broadway and who’s attending those productions. The Theatre Communications Group (TCG), the national service organization of the country’s not-for-profit theatres (NFPs), produces its annual Theatre Facts report, the most comprehensive picture of activity across a variety of NFP companies based on an comprehensive fiscal survey.
While the methodologies may vary, and the TCG report isn’t 100% inclusive and includes extrapolation, looking at the two is very informative as a means of comparing and contrasting these two sectors, which inexplicably to me seem to be always addressed discretely, rather than as parts of a whole.
Here’s the main snapshot:
| 2010-2011 Season |
|
|
|
Commercial
|
Not-for-Profit
|
|
(B’way League)
|
(TCG)
|
| Revenue |
$1,884,000,000
|
$2,040,000,000
|
| Attendance |
25,630,000
|
34,000,000
|
| Productions |
118
|
14,600
|
| # of performances |
20,680
|
177,000
|
I was surprised to find that in terms of revenue, the two sectors are quite close; the NFPs edge commercial production by $36 million (for the purpose of this summary, I have merged earned and contributed income in the NFPs). Attendance between the two shows the NFPs ahead by a bit over $8 million, which is almost 33%. But the real difference is in the number of productions, which demonstrate that the production pace in NFP theatre is vast compared to the commercial arena, and the total number of performances almost eight times greater.
Obviously caveats quickly arise: most of the NFP production is in houses of 500 seats or less, while that’s the minimum size in the commercial world, where theatres can reach over 3,000 seats. It takes only a handful of productions in commercial to generate nearly equal revenue to the entire NFP sector; that’s because a single production might play throughout the season, either on Broadway or on tour, while each NFP might produce a half-dozen shows in a year. Though production figures aren’t available, the budget of a single commercial musical might fund a mid-sized LORT theatre for two seasons, let alone countless storefront or LOA companies for years.
But what’s perhaps most interesting is that, operating under the reasonable assumption that each show has one director, one set designer, on lighting designer, one costume designer and one sound designer, those working in those fields are employed almost entirely by the NFP companies, since there are so very few opportunities in commercial theatre. Indeed, its not uncommon for the same designer in the select group that secure Broadway shows to do two or three in a season, and for those same designs to go out on tour, so when it comes to individuals, that count of 118 grows even smaller.
In terms of the aggregate economic force of Broadway, the League’s numbers show that Broadway and commercial touring generates significant income from a relatively small amount of shows. The TCG numbers show a more granular reach, with thousands of productions just edging the commercial world to reach a similar figure. But it’s the NFPs that are providing the vast majority of theatrical employment.
Let’s look at another measure of employment, specifically when it comes to actors. I think it’s a safe assumption to say that with musicals dominating commercial production, the cast size of an average show must surely outpace those found in resident theatre. Drawing upon employment data from Actors Equity for the same 2010-11 season, here’s the snapshot:
| AEA Employment |
2010-2011 Season |
|
Work Weeks
|
Earnings
|
| Production contract |
|
|
| B’way & tours |
73,505
|
$183,184,564
|
|
|
|
| LORT |
59,982
|
$52,583,175
|
| Developing Theatre |
46,116
|
$6,344,839
|
| Chicago Area |
7,438
|
$4,252,738
|
| Bay Area Theatre |
1,290
|
$644,749
|
| Total NFP |
114,826
|
$63,825,501
|
There’s obviously a staggering difference in compensation for performers in the two sectors, since with 40,000 fewer work weeks, the commercial productions yielded almost three times the earnings for its actors as the NFP companies provided. While certainly star salaries may have had something to do with this, it’s more likely because production contract minimum typically exceeds the top salary at any of our not-for-profit companies.
So what have we found? Resident, not for profit theatres provide the foundation for the vast amount of theatrical activity in the United States, employing the lion’s share of the artists and presumably staffs as well, and playing to about 30% more patrons. When it comes to overall sector income, the two are extremely close (although the inclusion of more of Equity’s smaller contracts might tip this slightly further). But for those fortunate enough to secure employment as actors or stage managers in commercial productions, the compensation far outstrips what’s paid by resident companies.
Next time you want to make a generalization about the difference between commercial and not-for-profit theatre, here’s your broad-based data to draw from. But there’s lots more where this came from, and I urge everyone in the field to review it, to understand both the divergences and similarities, and to better understand American theatre not as an array of silos, but as a whole.
* * *
Notes:
- Data from the Broadway League is drawn from their Broadway Season Statistics summary and their Touring Broadway Statistics summary, as well as information taken from their IBDB and provided by their press office.
- As previously indicated, revenue for NFP companies is inclusive of both box office and contributed income, since both are required to achieve the level of production represented within; commercial theatre may have some amount of sponsorship income, but it wasn’t broken out in the Broadway League survey, nor did I treat capitalization as income.
- There are almost two dozen AEA contracts not represented in the actor workweek summary, because I am not familiar enough with each contract to properly categorize it. The contracts included represent almost 2/3 of all AEA employment. It’s worth noting, by the way, that the Disney World-AEA contract covers 5% of all AEA annual work weeks, but does not factor in here.
- While the Broadway League has assembled its numbers for 2011-12, and as I was writing, AEA indicated that their figures for that period would be released imminently, 2010-2011 remained the period of comparison because that is the most recent TCG data available. It should be noted that once every seven years, the League has to compile its data into a 53, instead of 52, week season; 2010-11 was such a year, so the comparison of the data is imprecise, giving a quantitative edge to the commercial numbers.
December 4th, 2012 § § permalink
The Broadway League released the results of its annual demographic survey of audiences yesterday, and as always, it’s a useful snapshot of the Broadway audience, whatever your philosophical view of Broadway may be. The percentage of tickets purchased by tourists (those residing outside of the tri-state area) inched up to 63.4% of all tickets sold (a slight rise from the prior year’s 61.7, but showing that roughly two out of every three Broadway tickets are purchased by visitors, not locals. 18.4% of all tickets were purchased by international tourists, which means that nearly 20% of all ticket sales are to foreign residents, while a bit more than 40% are to U.S. travelers. This shouldn’t be terribly surprising, since a variety of surveys show that Broadway is the number one attraction for visitors to New York.
Although the news yesterday was about the demographics, a number of outlets treated the release as if it were the first announcement about Broadway’s audience during the 2011-12 season, when in fact the League issued a release on revenues and attendance on May 29, two days after the official close of the season as they define it (roughly June 1 to May 30 each year). Indeed, if you looked to The Hollywood Reporter, Entertainment Weekly or Deadline, you would have thought the League just managed to finish tallying the season that ended six months ago, as the demographics (admittedly inside pool) took a back seat to dollars and bodies.
The 2011-12 season marked a record high dollar gross for Broadway shows, at $1.13 billion, with total paid attendance of 12.33 million. While direct comparisons are slightly skewed, because for statistical reasons, the prior year had 53 weeks instead of 52, the figures were consistent with recent trends, with growth in revenues outpacing the growth in number of paid tickets. Yes, thanks to the innovation of VIP or premium tickets, the finite universe of theatres and seats manages to make more money with every passing year, because Broadway has fully embraced the simple economic principle of supply and demand.
You can expect that yesterday’s announcement will be followed in roughly four weeks time by the sales and capacity figures for the calendar year 2012 (as opposed to the theatrical season, creating a second opportunity for headlines sliced from the same data). So with percentages and numbers floating around, I decided to explore, on a top-line basis, how much of the Broadway wealth is being spread around, and how much of it is attributable to only a few shows.
Based on the tally drawn from IBDB.com, a total of 72 productions played, in whole or part, during the 2011-12 season, ranging from long-running hits like Phantom of the Opera to special limited events like Hugh Jackman: Back on Broadway. Of those, 41 were new productions, and it’s worth keeping in mind that there are only 40 Broadway theatres. Given that long runners occupy a portion of the designated real estate, this quickly reveals how many shows were coming and going throughout the year (as is the case every year), some intentionally (star vehicles that were planned for only 16 week stints), some not (Bonnie and Clyde).
So, I wondered, what were most people seeing? Utilizing data collated by The Broadway League, I pulled out the results of revenues and paid attendance for five shows, opting for those I thought might be the most popular. Here’s the results:
|
Show
|
Gross $
|
Paid Attendance
|
|
|
|
| Phantom |
45,574,189
|
567,537
|
| Spider-Man |
79,013,711
|
726,849
|
| Wicked |
91,024,950
|
728,950
|
| The Lion King |
87,912,528
|
686,429
|
| Book of Mormon |
72,228,118
|
452,898
|
|
|
|
| Five show total |
375,753,496
|
3,162,663
|
|
|
|
| B’way Season Total |
1,139,000,000
|
12,330,000
|
|
|
|
|
33.0%
|
25.7%
|
So what do we find? That out of 72 possible productions, five shows yielded 33% of the gross revenues for the Broadway season and 25% of the audience. That’s an awful lot of firepower in only five theatres. And given the nature of the shows and the length of some of the runs, I think it’s a fair assumption that those eight million tourists who attended Broadway last year bought a good number of the three million tickets sold by these shows.
What about Mary Poppins? What about Jersey Boys? I could have swapped either of them with Phantom and the results would have been almost identical. Why five shows – why not all seven? Simply for the optics of how a handful of shows can dominate Broadway, and five is somehow more effective than seven, to my mind at least.
When it comes to grosses, the presence of Book of Mormon has a significant impact: even though its paid attendance is smaller than any of the five shows selected, you can see that its gross is disproportionately high (it had an average ticket price of $159 in this period, compared to $80 for Phantom). But it isn’t an anomaly, it’s what you learn on the first day of Econ 101: the logical result of a smaller house, a hit show and premium pricing. We’re likely to see more shows follow this model as time goes on, as a “tight” ticket seems to only build demand.
All of this data goes to show that, when the theatergoing public thinks about Broadway, they’re likely defining it through the handful of shows that dominate at any given time, since those are the ones that most people see and those are the ones minting the money – and they are, as we’ve always surmised, the long-running hit musicals. And for all of the statistical benchmarks that make for success in headlines, the rising tide is not floating all boats — it’s concentrated in the hands of a very few hits, which have a disproportionate cut of the Broadway pie.
June 28th, 2012 § § permalink
To begin, an exercise. Below you’ll see four groups of shows, labeled A through D. Groups A and B have a common factor, as do groups C and D. Take a moment to see whether you spot the common ground. Now imagine the Jeopardy theme playing.
Group A: Grey Gardens, Hairspray, Once, Passion, The Producers, Nine, The Light in the Piazza
Group B: Sweet Smell of Success, Big, Nick and Nora, Carrie, The Red Shoes, Footloose
Group C: Once, Jersey Boys, Movin’ Out, Contact, Fosse, Crazy for You, Ain’t Misbehavin’
Group D: Good Vibrations, Never Gonna Dance, Saturday Night Fever, Swinging on a Star, Buddy, The Look of Love
Did you get it? A and B are both lists of musicals based on movies, groups C and D are lists of musicals which came to Broadway with scores that had originally been written for other media.
If you are a fan of Broadway musicals, odds are you’d be quick to declare your affinity, or at least respect, for the shows in Groups A and C, while I imagine you’re unlikely to come out with passionate statements about the artistry of the shows in Groups B and D. Although not shown above, I also suspect that my Group E would meet with general favor – Next to Normal, The 25th Annual Putnam County Spelling Bee, Urinetown, Book of Mormon, In The Heights – namely, the supposedly extinct, wholly original musical.
Why am I playing this parlor game? It’s because I hear certain assumptions about musicals, and particularly Broadway musicals, all the time and they tend to be generalizations, based on recent and often selective memory. So I set out to look at whether Broadway is being overrun by musicals based on movies, or jukebox musicals, thinking I’d look at the past 10 or 15 years, but that turned into 20, then 25, and finally I ended up studying all of the new musicals to play Broadway since the 1975-76 season.
Why 75-76? Because just as Oklahoma! was seen as a watershed in the development of musical theatre, I feel I can argue that the next (and to date, perhaps only other) watershed musical was A Chorus Line. While a look all the way back to the season of Oklahoma! might be edifying, both Broadway and society in general have changed radically in that time; without undertaking a master’s thesis (or without an intern to wrangle data for me), this more modern era seemed manageable.
To get right to the first headline: yes, there are more musicals based on movies than there used to be; there were four this year and five last year. The year A Chorus Line debuted, there wasn’t a single movie-based musical, so that might send you running to proclaim how great things used to be. In fact, you’d be further buoyed when I told you that season saw musicals based on classic Greek literature, Shakespeare and U.S. and world history. But I’d deflate you when I told you those shows were the major flops Home Sweet Homer, Rockabye Hamlet, 1600 Pennsylvania Avenue and Rex. A pedigreed source isn’t everything it’s cracked up to be.
What we did see more of back in the 70s were musicals based on books or plays which had also been made into movies, although the source cited for the musical was usually the original material; some examples of this are Chicago (a play, later the film Roxie Hart), The Grand Tour (the play Jacobowsky and the Colonel, later the Danny Kaye film Me and the Colonel), and Sarava (the book and film Dona Flor and Her Two Husbands). But what’s worth noting as well is that these weren’t books or films which were hugely well known and, in those pre-VCR days, they weren’t easily found either. For audiences and critics alike, they may have felt fairly new overall, successful source or not.
Though most think it of as a recent phenomenon, the jukebox musical was also already prevalent. Existing musical materials were frequently drafted into Broadway duty, although the early tendency was to do so in the form of a revue (Ain’t Misbehavin’, Eubie); in 79-80, a Cole Porter score was grafted (albeit unsuccessfully) onto Philip Barry’s Holiday as Happy New Year. In this era, perhaps the first major book-based jukebox musical was My One and Only, a troubled production that came out on top with a Gershwin score, following efforts by young avant-gardist Peter Sellars to crossbreed the songs with a Gorky play.
Sources in the 80s ranged from novels to comic books to plays to original stories to U.S. history, and movie-based musicals typically had literary antecedents, such as La Cage aux Folles and Carrie. The first shows I spotted in my sample that were based on original screenplays were from the 78-79 season: King of Hearts and Ballroom, the latter from a TV movie (although musical from movies certainly predated that; Promises Promises, from Billy Wilder’s The Apartment, is merely one prior example). Because films may also have their own source material, it’s sometimes hard to tease out when the movie in musical pattern really took hold (or if it was in fact something new), but the mid 90s seem to be a point at which they became more persistently present.
Yet now I’ll venture my first strong opinion on this, which is that, as Group A up at the top reveals, there’s absolutely nothing wrong with musicals based on movies. When it is done with enough craft, with care and talent, no one begrudges a show its origins, although there is a tendency to now judge the source even before the show is produced. It would also appear that, in many cases, the more successful examples of this genre are shows drawn from lesser-known films; the rush to translate recent hit films hasn’t necessarily meant greater box office success. Barreling ahead, I’ll say that while I think we need original scores lest the craft of musical theatre songwriting be lost, there have been terrifically entertaining and creative shows based on music cobbled together from other sources, whether it be earlier musicals, pop radio or a songwriter’s catalogue. Again, the only question is whether it’s done artfully.
My rather wide spreadsheet built for this overview ended up showing me some things I did not expect, which play into our perception of Broadway being “overrun” with jukebox musicals and musicals based on movies. By looking at Broadway seasons, shorn of all plays (new and classic), concert bookings (which used to be quite frequent) and revivals, an interesting picture of new musicals in the post-Chorus Line age emerges. A rather small picture.
Based on my research, there were 322 new musicals on Broadway in the past 37 years – which works out to an average of nearly nine a year. That is a startlingly small number when you consider that musical theatre is considered to be one of the major art forms that is innately American, and Broadway, whether we like it or not, remains the prime showcase for that work and the engine for its economic success. Yes, my time period covered the dark days of the eighties and early 90s, when Times Square was supposedly at its lowest. That didn’t keep critical and popular successes from arriving: A Chorus Line, Sweeney Todd, Dreamgirls, Big River, Phantom of the Opera, Miss Saigon, The Secret Garden, Tommy and more. What was happening was that fewer new shows were opening – coming off an already small number.
We’re not talking about a vast gap; in the late 70s, an average of 12 new shows opened each season, as already mentioned, the 37-year average is 9 (8.7 exactly). There were some truly dark years, but they’re not so long ago: 94-95 (2 new musicals), 2000-01 (five) and 01-02 (six). As the number of new shows dropped, the scales tipped even more disproportionately to movie-based and jukebox musicals. But there’s no clear pattern which demonstrates these type of shows having usurped or corrupted Broadway; without them, the number of musicals might be even lower. There simply aren’t other musicals being produced to fill out the roster.
It is true that without celebrities, and there are few bankable musical stars these days, producers are looking for titles or music with built in marketing pull, because when you’re raising $10 or $12 million for one show, you’re looking to mitigate risk. That said, look at my B and D lists and you know that there’s no sure thing. Yet that doesn’t stop people from trying to maximize potential, and that same rationale speaks to the affinity for revivals as well (although I’ve not studied whether there’s been a commensurate increase in musical revivals to balance out the loss of new shows). I will note that Broadway did once seem even more musical, as the 70s and 80s saw a plethora of short-run concerts, with a roster of performers that resembled those of Vegas showrooms, including Engelbert Humperdinck, Bing Crosby, Shirley Bassey, Peter Allen, and Patti LaBelle, as well as the occasional dance company, ice show (!) and three editions of Oba Oba.
The success of the major long-running shows, ushered in by A Chorus Line, has also served to hold down the potential for new musicals on Broadway, marketing and financing aside. With shows settling in for 10, 15, 20 year runs, there simply aren’t enough of the big musical houses available, and so fewer shows get on. There are only 40 Broadway theatres, and many are too small to sensibly house a musical. The Broadway musical is a victim of its present day success and a finite amount of space.
Although I can now speak only anecdotally, I daresay there are more people than ever studying and writing new musicals. In contrast to the golden age of the 40s and 50s, when the skill of writing musicals was learned on the job or through mentorships, we now have undergraduate and graduate programs in musical theatre; the regional theatre network, founded primarily to mount plays, has discovered the artistic and economic appeal of musicals; and there are countless developmental opportunities under a variety of auspices. Yet with rare exceptions, truly successful musicals are made on Broadway, the opportunities there have diminished, and every hit new musical suppresses the potential for other shows for years at a time. The musical development complex runs counterintuitively to the chances for major production.
Musicals made from movies will not kill the American musical, as they only succeed when they’re done well. Jukebox musicals will not eliminate new musical scores, because only the shrewdest interpolations yield a successful show. What will keep the American musical at low ebb is: a) a risk-averse mindset among some producers that opts for the familiar over the unknown, despite the great success in the recent past of wholly original work, b) the almost single-minded focus on Broadway as the locus of all musical success when it is only the most lucrative market for musicals; c) the inability of Broadway to provide sufficient berths for a higher number of new musicals annually; and d) the perpetual generation of more and more musical writers into a field that can encourage many of them, but sustain few. We need new avenues for the success of musicals that don’t require passing through Times Square and we need to eradicate the notion of Broadway and New York as the sole arbiter of a musical’s success. There are organizations attempting to do this, but the iconic nature of Broadway and its potentially considerable rewards still dominate.
The problem, however, is not Broadway; Broadway is an expensive and risky though potent option. The problem is that we have made Broadway the only hope. But we can’t. The numbers don’t lie: 8.5 new musicals a year, and fewer of those that run, is not enough to be the flagship for and to sustain an entire field of creative endeavor.
* * * *
Notes on process: Counts were based on information from Theatre World and Playbill Vault, both invaluable, but not completely consistent on records and which theatres were indeed Broadway houses, especially in the early years covered. Whenever possible, I erred on the side of inclusion, but someone else might count slightly differently depending upon their methodology and judgment. I considered new musicals to be newly constructed shows, using both new and existing scores, which could reasonably considered to be musical theatre; song revues like Ain’t Misbehavin’ or Swing I considered new musicals, while something like Tango Argentino or solo concerts, even when by impeccable artists such as Barbara Cook, were ruled out. I did not follow the Tony designations for “special theatrical events” during the decade that award existed, but judged each show on its own merits consistent with what I said previously. I would be the first to say don’t take my 309 count as written-in-stone gospel, but I’m confident that the trends and averages will hold up to scrutiny.
Update July 10: In preparing a follow-up to this piece, I re-reviewed the seasons in question using only the Playbill Vault for consistency’s sake. The post as it now appears reflects adjustments in numbers based upon that re-review, which reflect marginal changes which but do, as expected, maintain the ratios as originally determined.
August 2nd, 2011 § § permalink
Sometime in the 1970s, the once ubiquitous gossip columnist Rona Barrett began reporting box office grosses during her regular appearances on Good Morning America. Prior to that, such statistics were available only to readers of Variety, long the entertainment bible (and perhaps to Hollywood Reporter readers as well, though as a teen I only knew of Variety). What she unleashed was a revolution in entertainment reporting, in which the general public began hearing about weekly grosses for the movies, detailed Nielsen television ratings, volume of record albums (later CDs and later mp3) sold weekly, even the Broadway box office grosses. Across the country, what was once industry information became popular fodder, so much so that the movies manage to get press out of projected box office tallies on Monday, actual receipts on Tuesday and projected receipts on Thursday and/or Friday. Entertainment became about “the numbers.” (Ironically, in this same period, as Variety shrank, Off-Broadway and regional grosses disappeared, even for those in the industry.)
A successor to this awareness came courtesy of Amazon.com, which hourly updates every book’s sales rank, and while the number is based on relative sales and does not reveal the actual count of books sold, it has proven fascinating as well. For authors of newly released books, it’s like crack. Ask anyone you know who’s had a book published. If they don’t admit to checking their Amazon numbers frequently, they’re lying.
But “the numbers” have taken an interesting turn in these burgeoning days of social media. First, it was simply how many friends we have on Facebook (thereby diluting the true meaning of the word ‘friend’ for much of the world), then how many followers we have on Twitter. Most social media platforms provide some comparable measure, and in doing so, set up a competition among users.
We’ve learned just today that the numbers can be gamed, for a while at least: Newt Gingrich’s million Twitter followers turned out to be highly inflated, as the vast majority of them proved to be fictitious accounts created solely to aid those who were collecting numbers across Twitter; others were bots that automatically follow people, often in an effort to get them to click on highly suspect or even dangerous links.
The next step in social media numbers has been the emergence of services that seek to rank users influence in social media across platforms. Klout may be the best known, Peer Index is gaining recognition, and they’re proliferating: Twitsdaq, Twitalyzer, TwentyFeet and Tweetstats are among the many seeking to rank you (and get you to subscribe to their “premium,” paid analytical services). There are also reports that in some industries, employers are beginning to look at these rankings when considering candidates for jobs.
Why do I recount all of this? Because while we may not yet have bar codes tattooed on our arms or the backs of our necks (choose your own dystopian vision) , we are ourselves being reduced to numbers, our worth being determined by our online activity, with little leeway for vacation, illness, or simply the demands of everyday life.
I’m being hyperbolic, I hear you cry. Yes, of course I am. But once out of college and past the arbiter of class rank, we have been judged solely on our achievements. Perhaps those on Wall Street could be judged by earnings, or film stars on their quoted payday per movie, but the people and organizations involved in creating art were judged qualitatively and subjectively, not quantitatively by some unknown algorithm.
I have fallen prey to this insidious practice and its lure of achievement by rank. I am weaning myself from it, although only two weeks ago I took part in a series of e-mails with PeerIndex because I was convinced that their data on me was wrong (in fact, it was, and my ranking has been rapidly rising ever since). I shudder to think that, had I not caught this and some prospective employer decided to check up on me, I’d be viewed as a social media failure. But I’m now controlling the impulse to check my rank on all of these services daily, or to seek new tools of measurement, though I’m not about to forgo them completely (hey, Klout is sending me a $10 coupon because I’m influential enough to sample a sandwich company’s new pulled pork offering).
But I worry about numerical assessments of effectiveness, especially if social media becomes truly ingrained in the national psyche, and it’s certainly well on its way to being lodged there. Having worked in a field where the primary goal is qualitative (read artistic) achievement, albeit with budgetary and audience measures, we may begin to be judged not just on what we put on our stages or produce as individuals, but as influencers or the influenced, those who lead and those who follow. Now we don’t just hope for a maximum number of stars from a critic for our shows, or the greatest amount of money we can raise, we are being personally quantified, compared and scored.
During my years at the American Theatre Wing, I would often, when discussing The Tony Awards and its peers in film, TV and music, make reference to a fascinating book entitled The Economy of Prestige by James F. English. Boiling the book’s thesis down with utter simplicity, it explores the process of awards-giving for artistic achievement, and how that process will always be imperfect because by comparing, ranking and choosing a “best” among works of art, we are forcing those works out of the creative realm and into the language of the marketplace. So it is with social media ranking.
Klout, PeerIndex and their cohorts now dispassionately judge our organizations and ourselves daily, and their wider acceptance can only diminish our creative achievements. As a longtime fan of science fiction on the page and on film, I see these rankings and I fight against them like so many revolutionaries who fought (will fight?) futuristic totalitarian societies, and I want to shout, “I am a human being. I am a man of the theatre. I am not a number.”
Like all speculative fiction, we’re not going to know for a while what this all means, but maybe we can prevent SkyNet from becoming self-aware, stop the crystal in our palm from turning black, rebel against Big Brother. But it all depends. Are you keeping score?
This post originally appeared on the 2amtheatre website.

 In honor of this blatant effort to reach a designated threshold without utilizing meaningful content, I would like to present the very very very first “Lucy Van Pelt Award for Verbal and Political Padding” to Senator Tom Coburn (R, Oklahoma), for the 2014 edition of his much-publicized “Wastebook.” For those who haven’t heard of it, the Wastebook is Coburn’s perennial compilation of excessive and/or unnecessary federal spending. It tends to generate a good bit of attention for its most absurd items in all manner of media. A careful parsing of Coburn’s annual lists may reveal a partisan bent and a truckful of snark, though in reviewing the past few years of reports, I did note that he wasn’t above calling attention to what he deemed wasteful spending in his home state too.